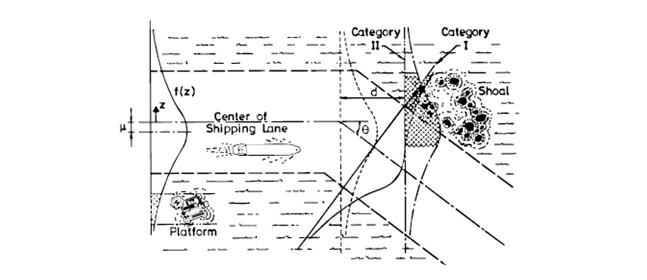
Lateral Traffic Distribution
Figure 11 Illustration of model for predicting the expected number of grounding events or collisions with fixed objects on a given ship route, from [25].
Assessing/modelling the traffic spread across the route
With access to AIS data it is a relative straight forward task to assess the probability distribution of the traffic spread across the route as well as the number and the composition of the vessel traffic.
When such data are not available it is a quite involved task to identify the needed data.
Only little guidance has been found in literature on the geometric distribution of the traffic. Typically a normal distribution is selected. Gluver and Olsen [12] proposed to apply a standard deviation equal to ship length. Alternatively the standard deviation of the Gaussian distribution can be selected to be proportional to the vessel breadth,σ = 3,65B. This choice corresponds to a 96% probability of the vessel being within ± 7.5B of the planned route, which again reflects the zone within which the navigator of the vessel identifies safe operation.
In the study by Karlson et al. [19] the standard deviation of the Gaussian distribution was chosen to 40% of the navigational channel.
|
Source: IWRAP Mk II, Basic Modelling Principles for Prediction of Collision and Grounding Frequencies, (draft working document), Rev. 4, 2008.03.09, Peter Friis-Hansen, Technical University of Denmark. |
